A very simple guide of Knowledge Graph for Health Data Scientists
This article aims for a very quick introduction of knowledge graph for those who are interested in its applications in health data science.
What is knowledge graph?
 Ok, what is a knowledge graph? In fact, many of us are using it almost everyday. For example, when you search the word
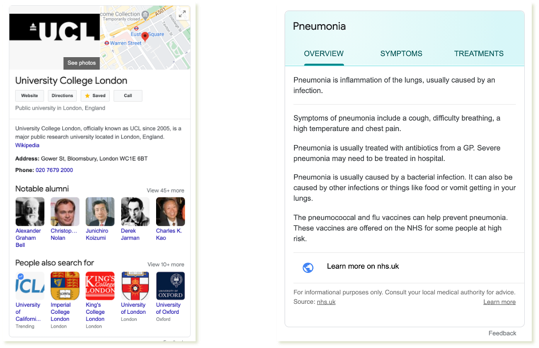
 UCL in Google. You will see a small box, called Infobox, at the right hand side of the the search result page. It gives you a quick summary of University College London, which includes the logo, Google map link, and key attributes including its address, the phone number and people related to UCL. All these data are actually pulled out by Google from ==its Knowledge Graph==. The assumption is that some or all of such information could serve as direct answers to the supposed question behind your search. And, like all of us have experienced, in many cases, the assumption holds.
Similarly, if you search a disease like Pneuonnia, Google will show you an even more structured infobox, which gives you the overview of the disease, its symptoms and also treatments.
Also, not surprisingly, if you search Google Knowledge Graph, Google will show you infobox of it. Of course, the information of Google Knowledge Graph is from Google Knoweledge Graph.
Where did Knowledge Graph come from?
Alright, so, where and when did this concept of Knowledge Graph come from? Sir Tim Berners-Lee, the father of the World Wide Web, proposed the idea of so-called the Web of Linked Data, meaning the Web should not just be interlinked documents but also interlinked data. It has another name of Semantic Web. The main game changing idea behind it is that interlinked data is directly understandable and usable by computers. In such a way, computers can automate tasks for you by talking to different web services directly. The idea of “web of data” is the root of knowledge graph. For those who would like to know more, you can check Sir Tim’s 2009 TED Talk on The Next Web.
Knowledge Representation is the core of Knowledge Graph
 Both “web of data” and “knowledge graph” share the same technical stack called
 knowledge representation. Essentially, it is composed of two main components:
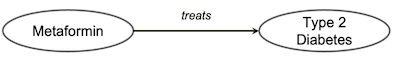
- the first one is called Ontology: which is a domain specific artifact that describes the concepts and their relationships in a particular domain. For example (the figure above), Type 2 diabetes is a human disease and Metformin is a drug that is used for treating type 2 diabetes.
- the second component is the Computation, that is how computer can do human like inference on ontology terms. It is called reasoning. Roughly, there are two types of inferences: one is based on set theory, and the other is rule based.
Technically, there is a suite of technologies for realising web of data (see here). W3C, the world wide web consortium, specifies technical details of all these technologies. As promised, I will not discuss any of these technical details.
A toy example of a clinical knowledge graph
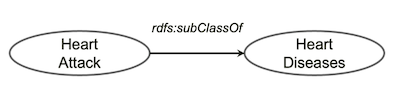 Let’s look at an example of knowledge graph. Suppose we all agree that
 heart attack is a type of heart disease and put it as a piece of knowledge in our knowledge graph (as above).
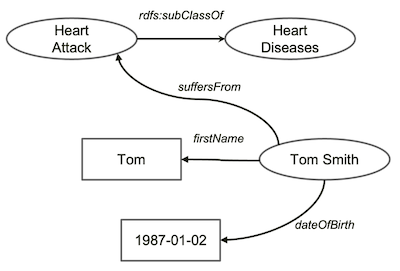 Now, we have a guy called
 Tom Smith. We know his basic information including names and date of birth. Unfortunately, Tom has had heart attack. We add all such information about Tom in our graph.
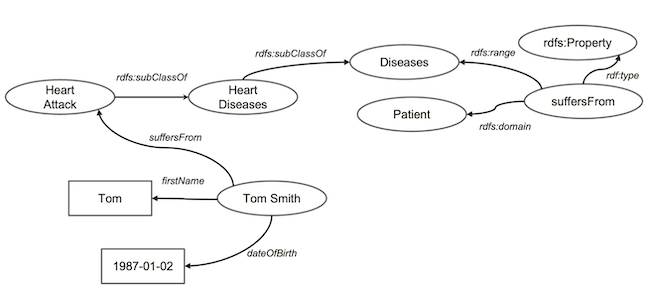 We now extend our knowledge about
 heart diseases a bit further. Let’s say all heart diseases is a disease. And, we define a relationship called suffersFrom, which associates patient to diseases.
 rdfs:Property is a relationship or an attribute in Knowledge Graph terminology.
 rdfs:domain and rdfs:range define the possible values of the source/target respectively of a rdfs:Property
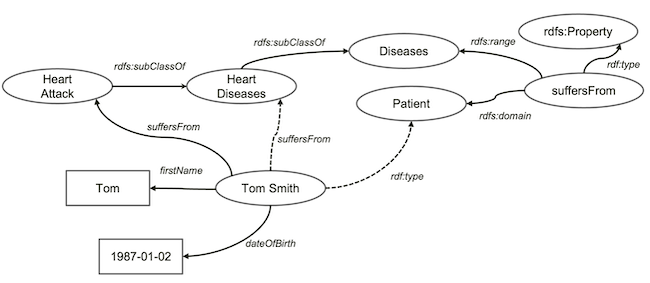 With such knowledge, computers can now infer some new knowledge from our knowledge graph. For example, it will say - okey, you said all
 heart attacks are heart diseases. So, anyone who suffers from heart attacks also suffers from heart diseases. Hence, the computer will draw the dashed arrow labelled suffersFrom above.
Now, the computer looks at the the definition of suffersFrom relationship, which says it associates patient to diseases. Now, because Tom Smith has two relationships of suffersFrom, then this person must be a patient. Therefore, it draws another dashed arrow.
Both inferred relationships might seem trivial to humans. But, it’s a pretty big step as computers can do human-like inferences, albeit tiny baby steps.
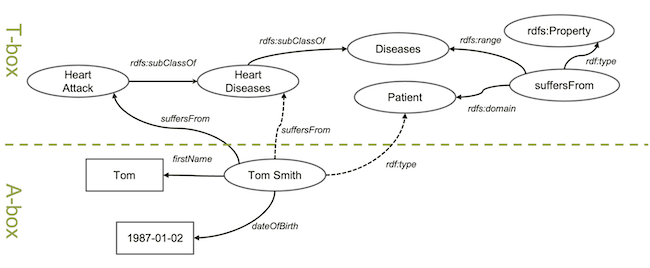 In knowledge graphs, we usually separate things into two groups:
 T-box and A-box. Anything about concepts and their relationships is part of the T-box, which stands for terminology box. Anything describing actual entities like specific patients is part of A-box, which stands for assertion box. Apparently, T-box is domain specific knowledge similar to schema of relational databases and A-box is the actual data that similar to the data rows in data tables.
Online Resources of T-Boxes and A-Boxes
The semantic web community has done a great job in creating and sharing both T-boxes and A-boxes for many domains and life-science is one of the most popular ones. For open-domain T-boxes, there is a great website called Linked Open Vocabularies. LOV now contains about 760 vocabularies (Ontologies) as of September, 2021.
For the biomedical domain T-boxes, there is a website called Bioportal, which is maintained by the U.S. National Center for Biomedical Ontology and led by the Stanford University. It is a must-have tool for people doing biomedical informatics. It has 922 ontologies (as of September 2021) including a lot of widely used ones covering diseases, drugs, genetics, and clinical procedures. Things like SNOMED-CT, UMLS, ICD and gene ontology are widely used.
For openly accessible A-boxes, the DBpedia is a widely used knowledge base that is essentially the structured version of Wikipedia. Understandably, it contains a wide range of open domain and common sense knowledge. This was a project led by German researchers. Wikidata is a collaboratively edited knowledge graph. It is maintained by >22k users and currently contains data of >95m entities, that is about 20 times more than DBpedia. There is also a community effort on open and interlinked A-boxes. It’s called the linked open data cloud and there are >1200 datasets across 10 different domains.
Summary
We have learned the four things about knowledge graph.
- What is a knowledge graph?
- Where did it come from?
- A toy example in clinical domain
- Online resources for using knowledge graph