
Derive insights from health data using knowledge graph technologies
This article describes how knowledge graph technologies can help with health data science, particularly on free-text electronic health records.
This is based on an invited talk that I gave at 1st International Symposium on Evidence-based Artificial Intelligence and Medicine.
For those who would like to know a bit about what is Knowledge Graph, you might find this knowledge graph introduction useful. I will use real-world examples to introduce how knowledge graph technologies can help clinical natural language processing. I will finalise this story with a bit of my own thinking in challenges and future directions of knowledge graphs for health care.
I appreciate that not everyone is interested in technical details. So, I will introduce the ideas in a kind of story-telling style.
Why bother using free-text clinical notes?
A significant proportion of the world’s data is in an unstructured format like news articles, Tweets and blogs. Some say 80% of our data is unstructured, while others estimate even more. Unsurprisingly, such phenomena is also observed in health care, such as electronic health records at hospitals. If you would like to know why/how exactly is free-text data useful? Please check this short story.
Two stories, one super-hard requirement
Ok, let me start with two stories from my own research experience. Both ended up with the same requirement that was almost impossible to fulfil.
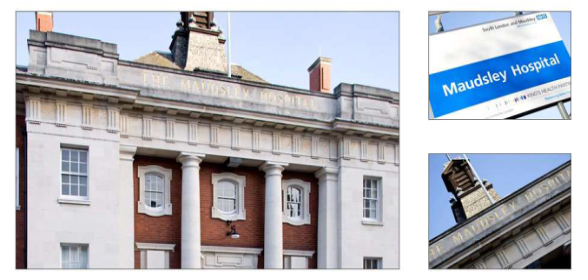
- Story #1 from South London in 2016. I worked with colleagues at South London and Maudsley Hospital (SLaM for short), which is the largest mental health service provider in Europe, with >330k unique patients records in 2016. SLaM is one of the pioneers in the UK to use NLP to derive useful clinical features from free-text documents, such as smoking status, depression symptoms and suicidal thoughts. When I started there, they have been doing this for >7 years, and they have >60 NLP applications routinely run on their data. Most of the apps were developed for identifying mental health related features. The project I joined was a bit ambitious, which was to identify all physical illnesses (such as diabetes, heart diseases etc) because they were interested in studying the interface between mental and physical conditions. Technically, they were interested in identify all 69k human diseases from ICD-10. ICD-10 is the International Classification of Disease version 10, one of the T-boxes from BioPortal we discussed previously.

- Story #2 from Edinburgh, Scotland, started in 2019. This is still an active project. I work with Public Health Scotland on the Scottish Medical Imaging project, which is to make all medical imaging data in Scotland available for research access. Here, we only talk about free-text structured reports, which are those reports you will get when you do MRI or CT scans in the hospital. There are >33m structured reports in the dataset. PHS is reluctant to make the reports directly accessible to researchers. The reason is understandable as free-text reports contain a lot of personal information that is almost impossible to be 100% anonymised. So, they propose to use NLP to look at all diseases, symptoms and clinical findings so that the results can be saved into a structured database. Then, researchers can access the database rather than the original free-text reports. Essentially, they are asking for an NLP model that identifies much more than the previous story’s 69k diseases, rather all biomedical concepts which is around 4m in total (as we will see later).
The mission impossible?
So, two different stories, but both ask for the same thing: one super-duper NLP model that identifies all diseases and phenotypes. No worries if you don’t know what a phenotype is. Basically it’s any clinical attributes that are important to health care, such as headache, sweating, drug uses, adverse events etc.
Implementing such a super NLP model is almost a mission impossible, not just for us - a group of academia researchers, but also very challenging even for tech giants like Google and Amazon. Let’s do a bit of analysis to see why so.
Two primary and one secondary challenges.
There are two challenges in realsing such a super NLP model - I call them primary challenges. There is also a secondary challenge that is even when you have such a system in place, it would be difficult to use for the end user, i.e., the clinical researchers.
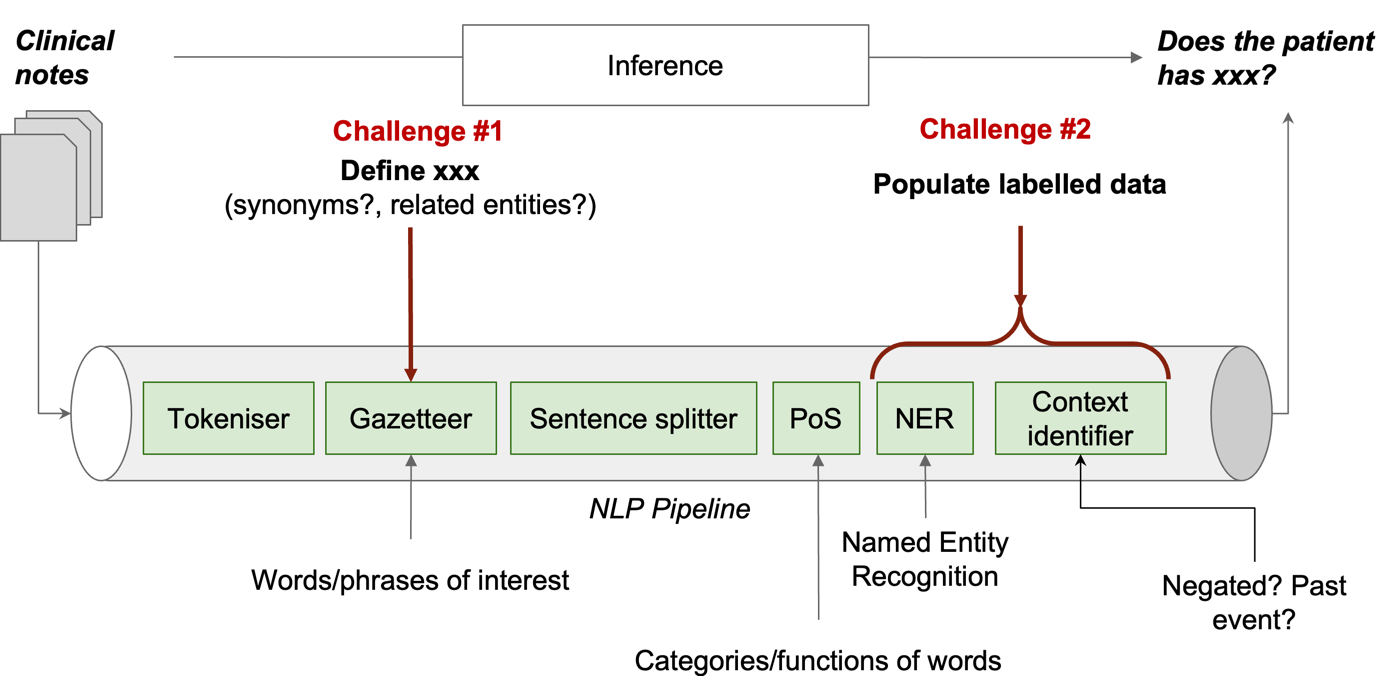
Let’s do a bit anatomy of a typical NLP pipeline (the figure above) to understand the challenges in implementing the super-duper NLP model. Note that the pipeline here is for explanation purposes and is not applicable to all NLP approaches, especially those using large neural-network language models like BERT or GPT. But, the challenges we discuss are generisable.
A clinical NLP model in general takes a set of clinical notes as input and makes an inference to answer the question of does the patient has xx?. Such a pipeline usually has a few components, each of which does one specific task on the free-text. All joined together to realise the inference. Let’s ignore all details and only look at two sets of components that are related to our challenges.
-
the second component in the pipeline is called Gazetteer. Essentially, it’s a dictionary that defines the set of concepts that we want to identify from the free-text data. For each concept, it will need to list all its synonyms. For example, for diarrhea, there are >20 different names. Apparently, all of them need to be listed. Furthermore, it is also necessary to define subtypes of concepts. For example, I supported a study looking at liver diseases where I found there are >70 different types of liver diseases. Of course, each subtype and its synonyms also needs to be included. So, for all 69k diseases, you can do the math of
69k x 70 x 20that is >100m names. And, disease classification systems like ICD-10 is not suitable as it does not have synonyms. Essentially, we need a comprehensive Gazetteer that defines all this information about human diseases. This is a huge effort that not a small team can do in a short period of time. I call this the knowledge representation challenge. If you still remember the terminology we used in knowledge graphs, it’s a T-box we need. -
The last two components in the pipeline are those to the heavy-lifting of identifying concept mentions from the free-text. In machine learning terminology, this is a supervised learning process, meaning ground-truth (i.e., human-labeled data in most cases) needs to be provided for the computer to learn from. Obviously, it is almost impossible to ask doctors to label data for all 69k diseases. So, this is the second primary challenge - none or not sufficient labeled data for learning. This is called low resource learning challenge.
The secondary challenge of using the big NLP result data
The final challenge is a secondary one. When you have such a system with all disease and phenotypes identified, obviously, it will be a big data space. You will need to search the space to get what is most relevant to your study. And, it might be challenging to do it efficiently. Let’s look at a real-world use case at SLaM hospital.
First of all, a bit of clinical background for this use case:
mood stabilizers are medications used to treat the bipolar disorder, which is a type of mental illness.
Suppose our use case is to identify bipolar patients by looking for those who are on mood stabilizers. Now, let’s say we have applied the super-duper NLP system on the whole SLaM data and identified everything. To find all bipolar patients, one would have to know all the mood stabilizer medications. It’s certainly not something a user, even an experienced clinician, cannot easily provide.
The solution
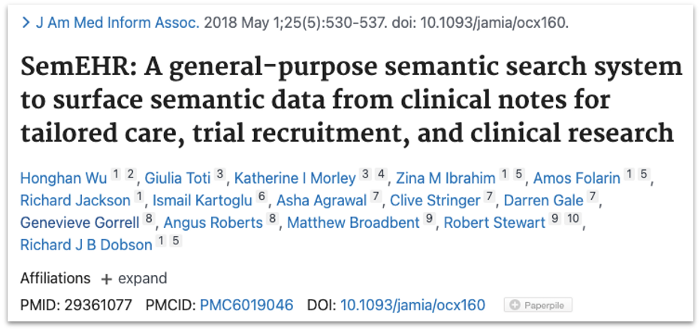 Alright, too much on challenges. Now, let’s look at solutions. I am going to talk about our work in using knowledge graph technologies to tackle the three challenges. This is a work we did from 2016-2017 and the software is called SemEHR. The system has been deployed in several hospitals in the UK. Technical details are in a paper published in the Journal of American Medical Association in 2018 and also at this Github Repo. Here, I give very high-level descriptions of approaches that are related to knowledge graph.
Tackling the knowledge representation challenge
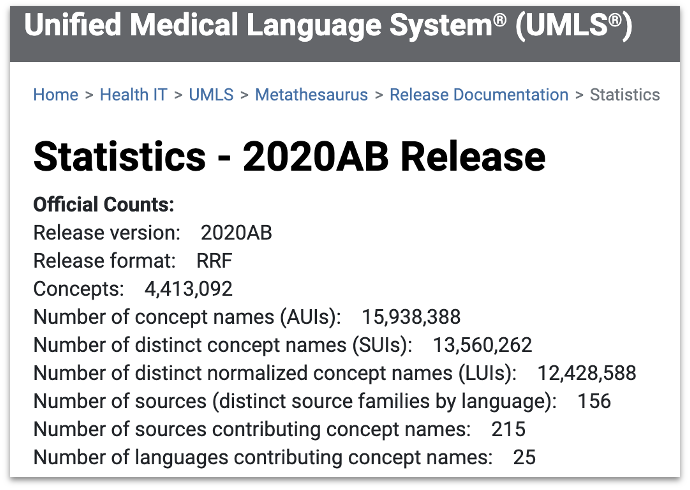 If you remember, the first primary challenge is the knowledge representation challenge. Essentially, we used an ontology called Unified Medical Language System. It covers a wide range of concepts - 4.4m in its 2020 release. Also, UMLS integrates a large number of biomedical ontologies - 215 to be exact.
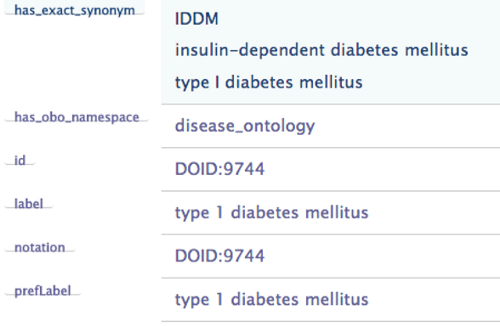 For each concept in UMLS, there is a set of labels, defining all the synonyms and also in different languages. For example, for type 1 diabetes, there is a property called has_exact_synonym, which links to three names. It also has a prefLabel property which gives the preferred label for the concept. These attributes are very useful for our NLP task.
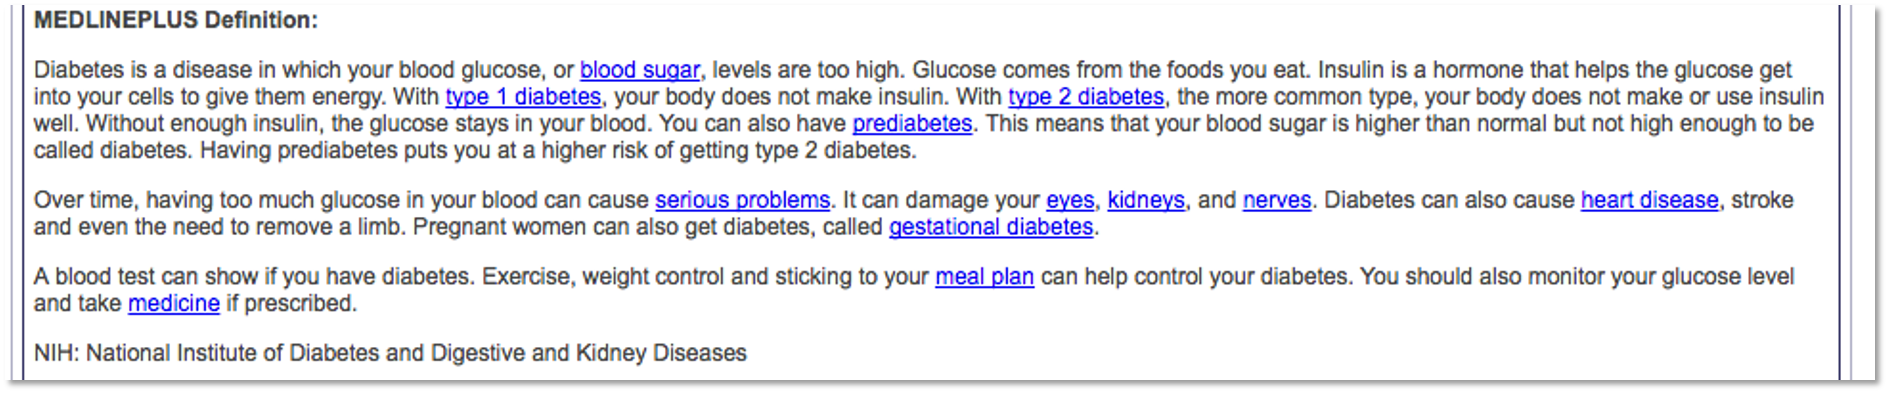 In addition to structured attributes, UMLS also provides textual description of each concept, which essentially is the clinical or biomedical interpretation of the concept. Such information is very useful for computers to capture the
 meaning of the concept in some form of mathematical representation. For example, use word2vect or doc2vect models. Such representation would facilitate NLP tasks significantly particular in disambiguation tasks, i.e., the cold in “she caught a cold” is different than the cold in “this winter is cold”.
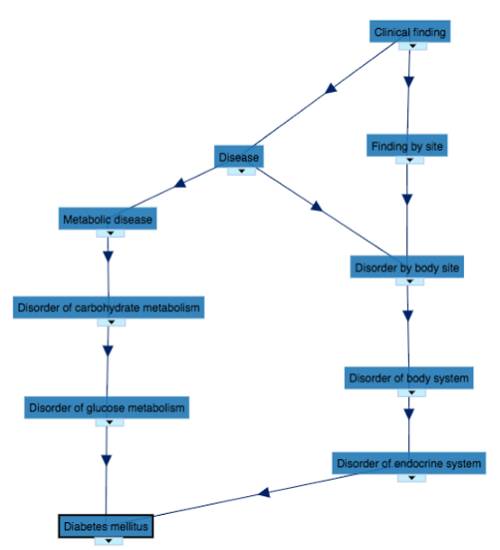 Furthermore, UMLS also provides associations between concepts in a graph format. Knowing which concepts are related to one concept and how they are associated enables computers do a lot of smart computations, some of which would make clinically sensible inferences. For example, knowing both type 1 and type 2 diabetes are a specific type of diabetes and Metformin is used to treat type 2 diabetes, the computer might infer this drug could potentially be useful for type 1 diabetes. Computationally, this inference is made by doing a few steps of walk on the graph. Such an inference is actually sensible as some clinical guidelines suggest the drug could be used for people with type 1 diabetes who are overweight and wish to improve glycaemic control while minimising the dose of insulin.
Tackling the low-resource learning challenge
Let’s now look at the second primary challenge - low resource learning, meaning we don’t have sufficient training data for all diseases or phenotypes.
To tackle this, we implemented two approaches. The idea of the first approach is simple: because we could not provide a super-duper NLP model that works well for everything, we provide a baseline model that can give you NLP results, which might or might not be good enough for certain studies. On top of the baseline model, we implemented a validation and iterative improvement mechanism to enable each user to check the performance by manually assess a randomly selected small set of NLP results. The system will generate performance metrics from the assessment and if performance is good enough (decided by the user) then everyone is happy. The NLP results are ready for downstream use. If not good enough, the assessment is essentially a small set of labeled data which will be fed back to the NLP system as further training data to further improve the NLP model. Doing such assessment and improvement iteratively will hopefully reach a stage that the performance is good enough. Normally, it takes 5-6 iterations. But of course, there are situations that the model just could not improve.
Due to the limitation of space, I won’t talk about the second approach. Instead, if you are interested, please check this paper: https://doi.org/10.2196/14782.
Join these together for solving the two primary challenges
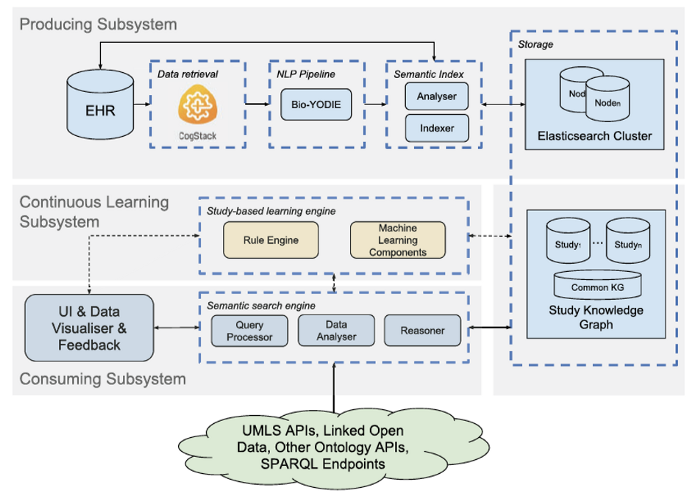 Let’s look at how things joined together in SemEHR for dealing with the two primary challenges. This figure is the system architecture of SemEHR. Let’s skip the details of individual components. The three horizontal gray rectangles denote the three subsystems. The top one is the producing sub-system that makes use of UMLS, a.k.a. the biomedical T-box, to produce a baseline NLP system. This tackles the first primary challenge of knowledge representation.
The gray rectangle in the middle is the so-called continuous learning sub-system that implements an iterative learning framework to enable a step-wise improvement based on user’s validation feedback.
The rectangle at the bottom is the consumption sub-system that tackles the third challenge, which is what I called secondary challenge of using the system. Let’s use one use case to illustrate how knowledge graph can help with this.
Automated inference for easing challenge #3
In 2017, I supported a study to look at the associations between mood stabilizers and heart diseases.
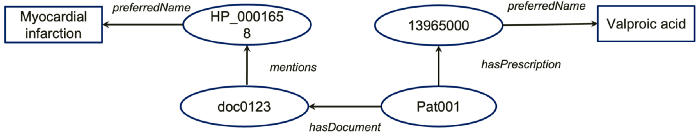
Let’s say that our NLP results generated a simple structured knowledge graph like this. It says: a patient Pat001 hasPresciption of a thing with an ID of 13965000 which has a preferredName called Valproic acid; Also, this patient hasDocument with an ID doc0123 which mentioned another thing with an ID HP_0001658, which has a preferredName Mayocardial infarction.
Ok, now, to answer our research question, we have the first query:
Are there any patients on mood stabilizer?
Look at A-box data only, the computer might say no, I don’t see any patients on the drug. However, remember we used knowledge graph technologies to populate our data from free-text. Knowledge graphs do have another important component called T-box.

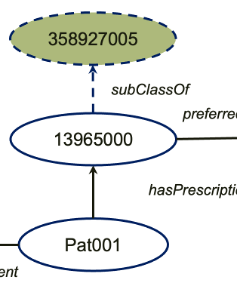
In this case, from an terminology called SNOMED CT, which is integrated by UMLS, there is an axiom that says the thing 13965000 is a subClass of 358927005, which has a label called mood stablizing drug. With this axiom, actually, the computer can expand our A-box with a new assertion, which tells us Pat001 is actually on one type of mood stabilizer (see below).
Ok, the second query of our research question is
Any mood stablizer users had heart diseases?
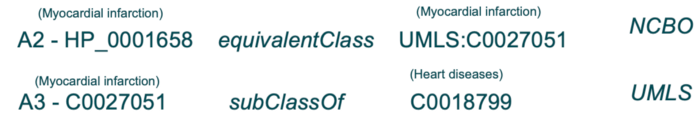
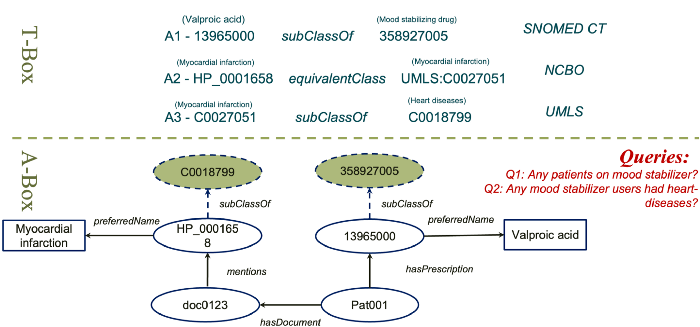
Again, using the A-box only the computer would say no. But, with T-box expansions, in this case, using two ontologies (see below), the A-box can be expanded. Now, we know that Pat001 actually had a type of heart disease called myocardial infarction.
The final knowledge graph including both T-box axioms used and expanded A-box assertions is shown below. It’s important to emphasise that computer can answer questions that previously not answerable, thanks to such knowledge graph based expansion.
Rule based inference
 The inferences we just saw are both subClassOf inference based on axioms in the T-box. In addition, there are rule based inferences to make the computers smarter. For example, we know
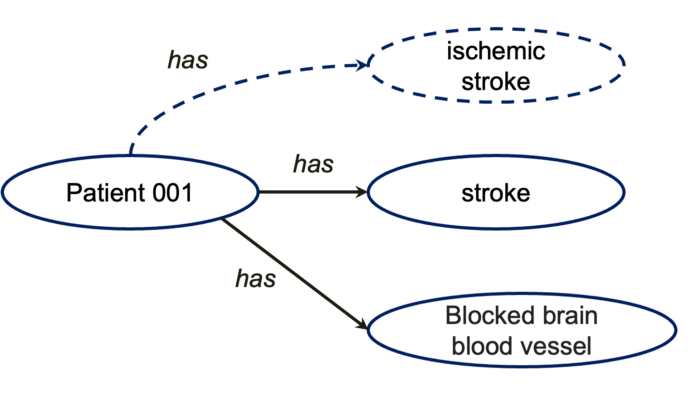
 ischemic stroke is a type of stroke where blood and oxygen to the brain are blocked. So, if we give computer a rule based on T-box concepts saying anyone has both STROKE and BLOCKED BRAIN BLOOD VESSEL, then this person is very likely to have ISCHEMIC STROKE. All these capitalised words are concepts in the T-box, e.g., UMLS.
Then, with this rule and this A-box, the computer will be able to infer that Patient 001 has ischenic stroke.
A case study: from NLP to knowledge-driven phenotyping
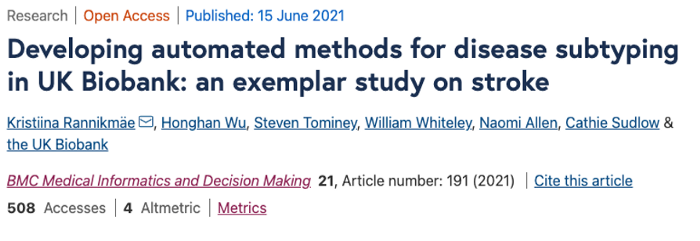
Recently, working with UK Biobank, we applied such knowledge graph technologies to automate disease subtyping from free-text data (Rannikmäe, et al. DOI:10.1186/s12911–021–01556–0). UK Biobank is a large long-term biobank study with >500k participants. In a previous study, we found 40% of stroke incidences were coded as unspecified, which means for these patients the structured data cannot tell you what types of stroke a patient has. We know different stroke needs to be treated differently. Only knowing unspecified stroke is clinically not very useful.
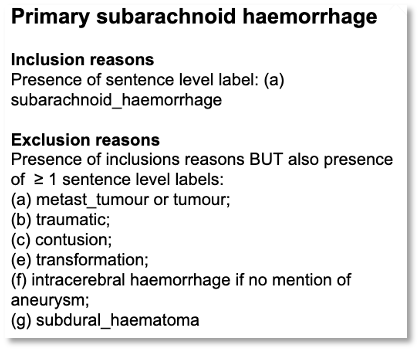
Our assumption was we could use knowledge graph + NLP technologies to automatically derive stroke subtypes from free-text data. We obtained brain imaging reports of these patients and used SemEHR to identify all stroke related phenotypes. Then, we asked the domain experts, i.e., neurologists , to write down their rules of diagnosing stroke subtypes (see one example below). These rules were then coded into our T-box. Then, previously mentioned inferences were applied to infer stroke subtypes automatically from NLP results. We proved that this approach worked pretty well on stroke.
Apparently, this is an exemplar study that goes beyond NLP to do patient-level phenotyping, thanks to the power of knowledge graph technologies.
Although we only focused on stroke in this case, such technologies are certainly applicable to a wide range of diseases because the knowledge graph we used covers all human diseases.
Summary: Reflection and Thoughts
Ok, that’s all the main content I would like to share with you. Now, let’s spend a bit of time to quickly reflect what we have discussed and some of my thoughts of challenges of knowledge graph for health care.
- We have discussed the concept of knowledge graph that are composed of a T-box describing concepts and their relationships in a domain and an A-box describing entities and their relationships.
- I introduced the system SemEHR which used knowledge graphs with NLP technologies for identifying all human diseases from free-text health data.
- Specifically, we discussed how the technologies helped tackle three challenges: two primary challenges in implementation and one challenge in using it.
What works of using knowledge graph in health care?
So, if I have to use one sentence to summarise the benefit of knowledge graphs for health care, that would be: the provision of super valuable biomedical T-boxes plus lightweight reasoning mechanisms.
What is missing of knowledge graph for health care?
What’s missing in current health knowledge graphs? The first thing I would like to say is the patient-level knowledge is missing. When you combine things at the life timeline of a patient, things do conflict with each other or have causal relationships. But current knowledge graph technologies could not represent these. For example, we know if a person has type 1 diabetes it’s very unlikely he/she has type 2 diabetes. But, we do not have such conflicting knowledge expressed in any ontologies.
Similarly, is it possible to have both ischemic stroke and hemorrhagic stroke? A quick thinker might say NO, because the two mechanisms are not compatible. But, what if a patient had an ischemic stroke and then had a fall? Again, We don’t have such mechanism knowledge representation at patient level.
Written by: Honghan Wu